CFS Index

The CFS Index, compiled from a comprehensive quarterly survey of leading executives in the German financial sector, aims to reflect the prevailing market sentiment on the most important issues and risks facing the sector as well as near-term prospects.

Don’t miss any news

Contact form for possible participation in the surveys

The CFS Index has been calculated since the beginning of 2007. In the first phase, it focused on companies and institutions from the Frankfurt/Rhine-Main region. Since the end of 2007 the German financial sector as a whole has been covered. The survey-panel consists of enterprises and institutions of the financial sector (“Financial Institutions”) as well as selected companies that profit from the financial sector (“Service Providers”).

  • Financial Institutions
    e.g. banks, insurance companies, asset managers
  • Service Providers
    – companies that are closely linked to the financial industry but also work for other branches as for example law firms, advisory companies or news agencies.
    – supervisory bodies and regulators such as Deutsche Bundesbank and the Federal Financial Supervisory Authority (BaFin)
    – lobby groups and academic institutions that have an expert knowledge about the financial industry
    – companies that profit from financial centers like Frankfurt or Munich such as airlines, hotels, luxury car leasing companies or catering firms.

Future Prospects

The CFS aims to establish the CFS Index as an early indicator for the economic development of the financial sector in Germany. Although the financial sector is very important for the economic development in Germany as a whole, other indicators such as the ifo business climate or the ZEW business expectations do not cover this economic branch.

Don’t miss any news

Contact form for possible participation in the surveys

Current survey

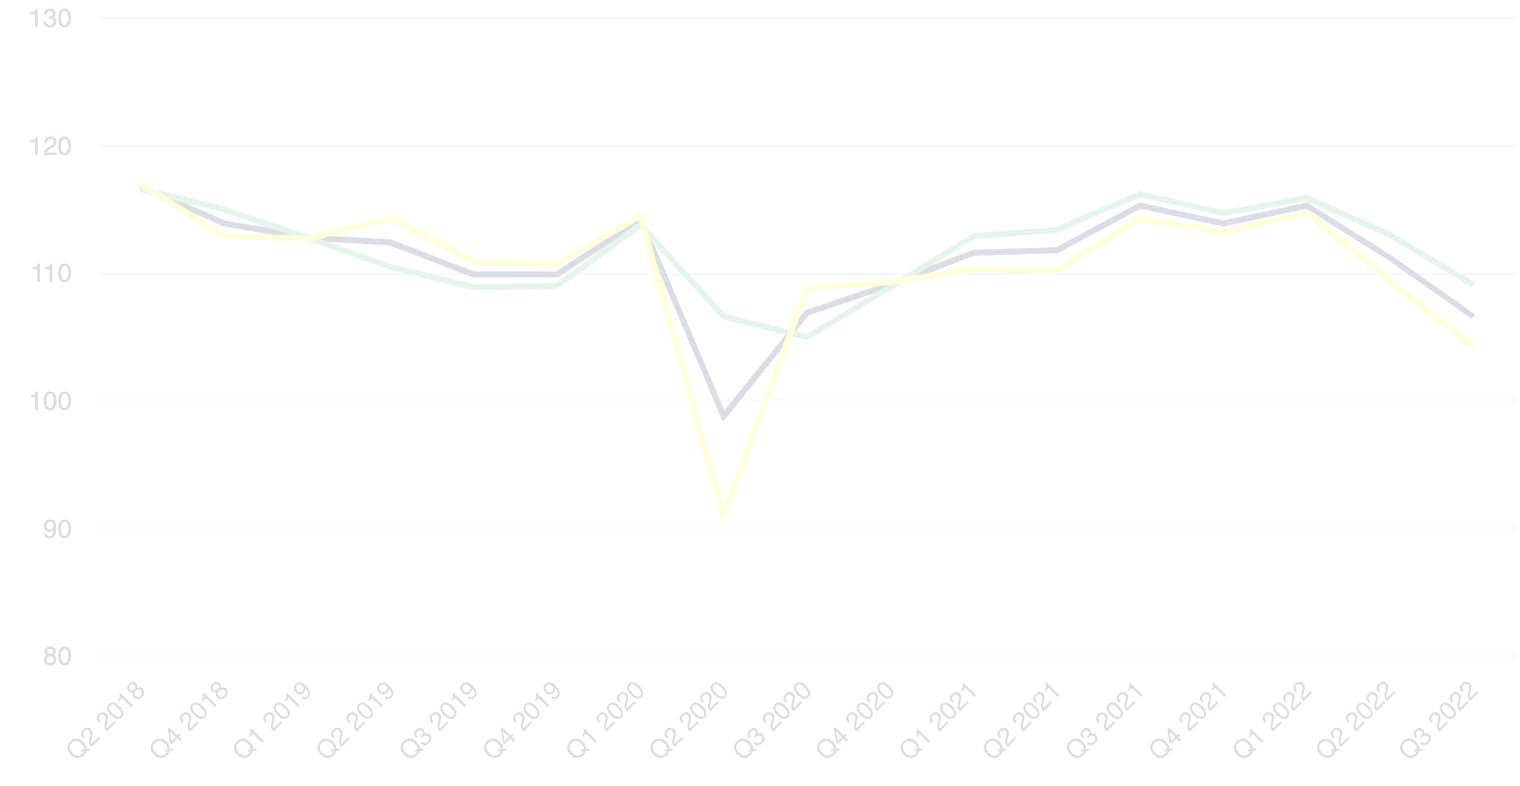
The CFS Index Chart uses technologies from Google. To view the chart, click the button below and confirm the use of external media in the privacy settings.

Load content

Last value: 106.5

Current value: 107.2

Last survey:
12.-19. February 2024
Next survey:
TBA
Last results:
29. February 2024
Next results:
TBA

Past survey

Survey Periods Date of Press Release Press Releases (pdf)
Q1 12 – 19 Feb. 29 Feb CFS Index | Survey | Presentation
Survey Periods Date of Press Release Press Releases (pdf)
Q1 12 – 30 Jan. 9 Feb CFS Index | Survey | Presentation
Q2 24 Apr – 02 May 11 May CFS Index | Survey | Presentation
Q3 07 – 04 Aug 24 Aug CFS Index | Survey | Presentation
Q4 13 – 20 Nov 30 Nov CFS Index | Survey | Presentation
Survey Periods Date of Press Release Press Releases (pdf)
Q4 17. – 24. Oct. 3. Nov CFS Index | Survey | Presentation
Q3 4. – 11 July 26. July CFS Index | Survey | Presentation
Q2 25 Apr. – 2 May 12 May CFS Index | Survey | Presentation
Q1 17 – 24 Jan. 4 Feb. CFS Index | Survey | Presentation
Survey Periods Date of Press Release Press Releases (pdf)
Q4 11 – 18 Oct. 28 Oct. CFS Index | Survey | Presentation
Q3 5 – 12 Jul. 22 Jul. CFS Index | Survey | Presentation
Q2 29 Apr. – 4. May 11 May CFS Index | Survey | Presentation
Q1 20 – 27 Jan. 4 Feb. CFS Index | Survey | Presentation
Survey Periods Date of Press Release Press Releases (pdf)
Q4 21 – 28 Oct. 5 Nov. CFS Index | Survey | Presentation
Q3 15 – 22 Jul. 30 Jul. CFS Index | Survey | Presentation
Q2 15 – 22 Apr. 30 Apr. CFS Index | Survey | Presentation
Q1 27 Jan. – 03 Feb. 10 Feb. CFS Index | Survey | Presentation
Survey Periods Date of Press Release Press Releases (pdf)
Q4 28 Oct. – 4 Nov. 11 Nov. CFS Index | Survey | Presentation
Q3 27 Jun. – 05 Aug. 12 Aug. CFS Index | Survey | Presentation
Q2 26 Apr. – 03 May 10 May CFS Index | Survey | Presentation
Q1 30 Jan. – 06 Feb. 14 Feb. CFS Index | Survey | Presentation
Survey Periods Date of Press Release Press Releases (pdf)
Q4 19 – 26 Nov. 03 Dec. CFS Index | Survey | Presentation
Q3 13 – 20 Aug. 24 Aug. CFS Index | Survey | Presentation
Q2 04 – 11 Apr. 10 Apr. CFS Index | Survey | Presentation
Q1 09 – 16 Jan. 23 Jan. CFS Index | Survey | Presentation
Survey Periods Date of Press Release Press Releases (pdf)
Q4 04 – 11 Oct. 19 Oct. CFS Index | Survey | Presentation
Q3 07 – 14 Jul. 21 Jul. CFS Index | Survey | Presentation
Q2 20 – 27 Apr. 5 May CFS Index | Survey | Presentation
Q1 04 – 11 Jan. 23 Jan. CFS Index | Survey | Presentation
Survey Periods Press Releases (pdf)
Q4 04 – 11 Oct. CFS Index | Survey | Presentation
Q3 06 – 13 Jul. CFS Index | Survey | Presentation
Q2 11 – 18 Apr. CFS Index | Survey | Presentation
Q1 11 – 18 Jan. CFS Index | Survey | Presentation
Survey Periods
Survey IV 05 – 12 Oct.
Survey III 06 – 13 Jul.
Survey II 13 – 20  Apr.
Survey I 13 – 19 Jan.
Survey Periods
Survey IV 06 – 13 Oct.
Survey III 07 – 14 Jul.
Survey II 31 Mar. – 7 Apr.
Survey I 06 – 13 Jan.

All news on the index

Calculation

The CFS Index is compiled from different sub-indices. Panel participants are asked questions about four different business parameters: transaction volume, profits, employment and investments, The answers may be given as “positive”, “neutral”, or “negative” and a response is requested for the previous and the current quarter.

All participants are allocated to two branch-specific groups. Within each group, a balance of the share of positive and negative responses is evaluated and transformed into performance data. These performance data are then aggregated in order to constitute the CFS Index. Due to construction, the maximum index value is 150, the minimum index value is 50; a value of 100 signalizes a neutral business sentiment.

Partners